Search
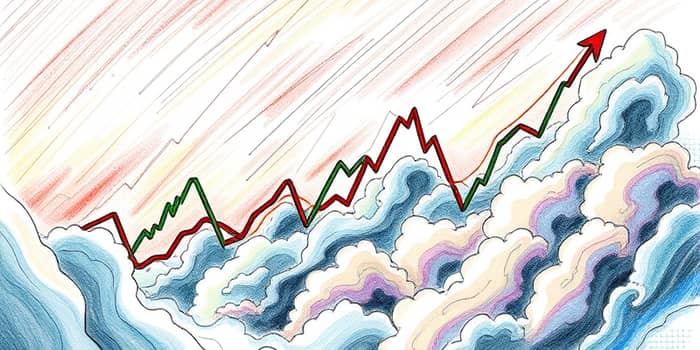
In times of turmoil, understanding how assets move together can mean the difference between weathering the storm and being swept away. This comprehensive guide empowers you with the knowledge and tools to navigate market stress with confidence.
Asset correlation measures how two investments move in relation to each other, from a perfect negative (–1) to a perfect positive (+1). While diversification relies on uncorrelated or negatively correlated assets, correlations can shift dramatically under strain.
When markets calm, historical patterns prevail. Yet, during crises, a phenomenon called correlation breakdown often occurs—assets that usually diverge begin moving in unison, amplifying losses across portfolios.
At the heart of correlation analysis lies the Pearson coefficient:
ρₓ,ᵧ = Cov(X,Y) / (σₓ · σᵧ), where Cov is covariance and σ represents standard deviation.
Practitioners categorize correlations into ranges that signal different levels of co-movement:
Several forces drive correlations higher when markets falter:
Historical crises illustrate these dynamics vividly. In 2008, even bonds and gold spiked alongside equities as liquidity evaporated. Similarly, the COVID-19 shock of March 2020 saw global assets tumble in tandem.
To stay ahead of unexpected correlation surges, adopt real-time correlation monitoring tools:
Combining these approaches offers a multi-dimensional view of risk and interaction. A spike in the cross-asset correlation matrix can alert you to potential systemic shifts.
Embedding stress scenarios into your process helps quantify vulnerability. Construct extreme but plausible situations—such as a sudden interest-rate spike or currency shock—and measure portfolio response.
Key steps include:
Institutions often track downside capture metrics to see how much downside they bear when equities fall. A near-zero beta with low R-squared in downturns signals effective market neutrality.
When correlations surge, standard diversification may falter. Here are proactive risk management strategies to strengthen your defense:
Consider a balanced portfolio of 60% equities and 40% bonds. As equity-bond correlations spiked toward +0.6 in early 2020, a tactical shift reduced equity weight to 45% and increased bonds to 50%, adding cash. This adjustment:
Correlation analysis has inherent limitations. Relationships are not static, they evolve with policy changes, market structure shifts, and sentiment swings. Overreliance on historical data can mask emerging risks.
Moreover, diversification cannot eliminate systemic events—only reduce unsystematic risk. Investors should remain vigilant, blending quantitative insights with qualitative judgment.
Ultimately, successful navigation of stressed markets hinges on mindset as much as metrics. Cultivate a culture that values continuous learning, scenario planning, and collaborative risk dialogue.
By integrating correlation monitoring into daily workflows and fostering a proactive risk management ethos, you position yourself to anticipate shifts, protect capital, and seize opportunities when others are paralyzed by fear.
In the ever-changing financial landscape, understanding and monitoring asset correlations during market stress is your compass through uncertainty. Armed with robust analytics, disciplined strategies, and a resilient mindset, you can turn turbulence into a catalyst for strength and growth.
References